


JUNE MARKET PERFORMANCE
The Pulse
|
Global economies
Global equity markets have been dominated by two events in June – the Greece debt crisis and the increased volatility in the China Shanghai Composite Index. The index declined 25% during June, and, follows the 150% increase in the previous 12 months.
Given the volatility acrosss the Eurozone and China, the US continued to be seen as a safe haven. The US remains a key driver of global growth and economic data continues to be positive.
Although the Greece crisis dominated events in June, the broader Eurozone economic recovery continued to improve as the quantitative easing began to have an impact.
China has continued its stimulus measures with further interest rate cuts and has also introduced specific policies to minimise the volatility in the share market.
The RBA maintained the cash rate at 2% at its July meeting and retains an easing bias.
US
In the US, the economic recovery continues to gain traction. The June manufacturing Institute of Supply Management (ISM) data continued to improve to 53.5, up from May’s 52.8 and April‘s 51.5.
The June non farm payroll data came in at 223,000 compared with an average monthly gain of 250,000 over the prior 12 months. The change in total non farm payroll data for April was revised down from 221,000 to 187,000, and the change for May was revised down from 280,000 to 254,000. With these revisions, employment gains in April and May combined were 60,000 lower than previously reported.
However, the unemployment rate has continued to decline to 5.3% in June from 5.5% in May. The number of long-term unemployed (those jobless for 27 weeks or more) declined by 381,000 to 2.1 million in June. These individuals accounted for 25.8% of the unemployed. Over the past 12 months, the number of long-term unemployed has declined by 955,000.
The S&P/Case Shiller composite price index of 20 metropolitan areas gained 4.2% yoy in April indicating housing strength.
The US 2015 corporate earnings growth has been lowered to 1.5% (revenues to –1.9%) while the 2016 estimated earnings growth, is at 11.9% (revenue growth at 5.8%).
The current 12-month forward Price Earnings (P/E) ratio is 16.5. This P/E ratio is above the 5-year average (13.9) and the 10-year average (14.1).
Europe
Over to the Eurozone, the Greece crisis has dominated events. The Greece referendum arrived at a ‘No’ vote to the question whether to accept the European credit lenders’ terms and conditions. Although this has created considerable uncertainty across global markets, the reaction across global equity markets has been relatively contained to date. However, we expect that further meetings between the European Central Bank (ECB)/International Monetary Fund (IMF) and the Greek Government will continue post the referendum in order to define an appropriate forward strategy.
The final Markit Eurozone Purchasing Managers’ Index (PMI) Composite Output Index posted 54.2 in June, up from 53.6 in May. The upturn in June also took the average index reading for Q2 to a four year high.
In June, rates of growth improved in both the manufacturing and service sectors. Manufacturing production rose at the joint quickest pace in a year, while the expansion in service sector business activity was the fastest since May 2011.
Economic growth accelerated in Germany, Italy and France during June, hitting a two-month high in Germany, 12-month peak in Italy and 46-month record in France. The French manufacturing sector signalled an expansion of output for the first time since May 2014. This represented a meaningful pick up across the major Eurozone countries.
Service sector business activity growth accelerated to a four-year high in June, as output expanded in each of the ‘big-four’ eurozone economies.
In June, business activity expanded at the strongest rate for just over four years and hiring remained resilient. The combination of ECB stimulus and low inflation appears to be boosting spending among consumers and businesses, and to date has offset the Greece debt crisis.
China
In China, the People’s Bank of China (PBoC) has provided a number of stimuli to stabilise both the economy and the stock market.
China’s central bank has moved to avoid panic selling on the stock market, cutting interest rates and reducing banks’ capital requirements in its most aggressive action since 2008.
The PBoC cut the benchmark rate by 25bp to 4.85%, and the deposit rate to 2%. It also announced targeted reserve requirement ratio (RRR) cuts of 50 basis points for some lenders.
The China Shanghai Composite Index had risen 150% over the past 12 months. The subsequent 26% correction over the past 3 weeks has placed considerable pressure on the Central Bank. In response to this, PBoC rolled out emergency measures in early July.
These include brokerage companies and fund managers agreeing to buy considerable amounts of stocks and restrictions to selling stocks. This will be supported by China’s state-backed margin finance company and supported by the PBoC. China has also orchestrated a halt to new share issues, with 28 initial public offerings being placed on hold.
The HSBC China Composite PMI pointed to a further rise in total business activity during June. The rate of expansion eased marginally from the May data
Asia region
Over to Japan, the rate of improvement in operating conditions at Japanese manufacturers slowed in June. Production growth weakened alongside a decline in new work intakes. According to anecdotal evidence, a reduction in capital investments and challenging economic conditions led to the recent contraction in total new orders.
Despite the marginal slower activity, employment levels remained in growth territory for the third month in a row. International demand strengthened in June, as new export orders increased at the fastest pace in 1.5 years.
June data pointed to a decline in output in the Indian private sector economy. Falling to 49.2, from 51.2 in May, the seasonally adjusted Nikkei India Composite PMI Output Index recorded below 50.0 for the first time since April 2014. Reductions in activity were centred at service providers, as manufacturing production rose during the month.
As indicated in June, the IMF expects the Indian economy to more than double in size in the 10-year period finishing in 2019. India’s growth came in at 7.2% in the financial year ending in March 2015. This is expected to accelerate further to 7.5% this financial year. As indicated, India will be the fastest-growing large economy in the world in 2016.
Australia
Back home, the Reserve Bank of Australia (RBA) kept the cash rate at 2.0% at its early July meeting. The RBA continues to be focused on the ongoing data but retains an easing bias. It’s expected that the cash rates at current or lower levels will continue well into 2016.
The RBA also indicated that a further decline in the exchange rate is seen as ‘likely and necessary”. On the housing market, the Board noted that investor credit growth has eased back towards APRA’s 10% guidance and that Australia’s capital cities were experiencing diverging rates of house price inflation with Sydney being the strongest market.
RBA credit growth in May shows constant housing credit growth, with investment housing at close to the 10% official growth limit.
Business credit growth picked up in May. Annual business credit growth was 5.2%, up from April’s 4.9%. As for the other components, housing credit growth was up 0.5% in May and 7.2% yoy. Within housing credit, owner-occupied lending, up 0.4% in May and 5.7% yoy and investor lending, up 0.8% in May and 10.4% yoy.
Australian building approvals in May rose in headline terms, by 2.4% and 17.6% yoy. The construction pipeline of new dwellings has continued strongly, while, separate approvals for residential ‘alterations and additions’, currently one third of total dwelling investment, is now accelerating.
Building approvals remained at a strong level in trend terms. Residential building approvals were running at a 231,600 trend annual rate in May which, allowing for construction lags, will still deliver growth in new residential construction well into 2015-16.
Australia’s tourism has been improving. Short term visitor arrivals are now outflanking resident short term departures. In April, arrivals were up 7.4% yoy. Visitors from China (+19.1%) and India (+29.9%) are growing rapidly, but also the UK (+5.6%) and US visitors are increasing in numbers.
Although house price growth waned in May, the June data witnessed a continuation of the upward trend. The CoreLogic RP June data saw a return to stronger house price growth in Sydney (+2.8%) and Melbourne (+2.9%). On a yoy basis, Sydney is up 16.2% while Melbourne is up 10.2%. The combined capital cities are up 9.8% in June. Apart from Sydney and Melbourne, Brisbane (+3.4%), Adelaide (+4.5%), Perth (-0.9%), Hobart (+0.9%) and Darwin (-2.9%) were all relatively subdued.
Equity markets
|
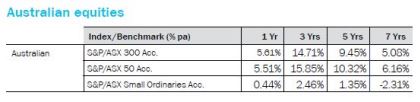
The S&P/ASX 300 Index was down 5.5% in June while the S&P/ASX 300 Accumulation Index was down 5.3%. The 12 month return on the S&P/ASX 300 Index was 1.1% while the 12 month return on the S&P/ASX 300 Accumulation Index was 5.6%.
The S&P/ASX 300 Industrials Index was down 4.8% in June, while the S&P/ASX 300 Industrials Accumulation Index was down 4.6%. The 12 month S&P/ASX 300 Industrials Accumulation Index was up 11.2%.This strong 12 month result reflected the strong returns from the Healthcare, A-REITs, Telcos and Utilities sectors.
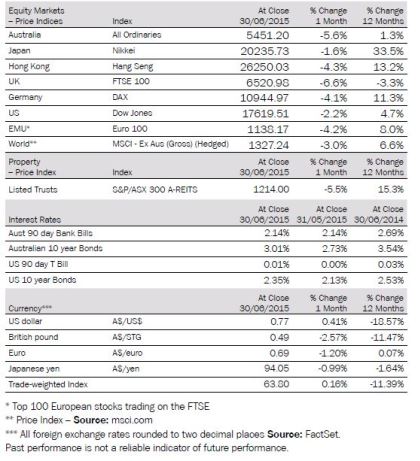
The broader S&P/ASX All Ordinaries Index was down 5.6% in June and on a 12 month basis, the Index was up 1.3%.
The large market caps represented by the S&P/ASX 50 Index underperformed, down 4.9% in June and on a 12 month basis the Index was up 0.8%. The S&P/ASX 50 Accumulation Index was up 5.5% in the 12 months ending 30 June 2015.
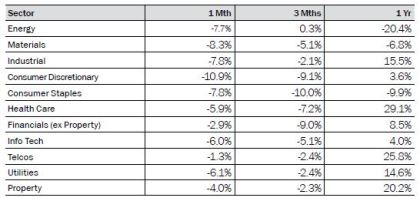
All ASX sectors were lower in June. The Consumer Discretionary sector was the worst performer, down 10.9%, while Telcos was the best performer, down 1.3%. Materials, Industrials, Consumer Staples and, Energy were also sharply lower, 8.3%, 7.8%, 7.8% and 7.7% respectively.
|
Big movers this month |
||
|
Going up: |
No sectors were higher |
|
|
|
||
| Going Down: |
Consumer Discretionary -10.9% |
|
|
|
Consumer Staples -7.8% |
|
|
Materials -8.3% |
||
|
Industrials – 7.8% |
||
As a result of nervousness around the Greece debt crisis, global equity markets were also sharply lower in June. The Japanese Nikkei, up strongly in May, and although down 1.6% in June, was the best performer across global equity markets. European equity markets were particularly hard hit with the UK, France and Germany down 6.6%, 4.4% and 4.1% respectively. Australia was also impacted with the All Ordinaries down 5.6%, a combination of the Greece crisis and also the sharp fall in the Chinese market and lower commodity prices. The US markets, although down, performed better than the European markets. The S&P500 was down 2.1%. The China Shanghai Composite Index was down 7.3% in June.
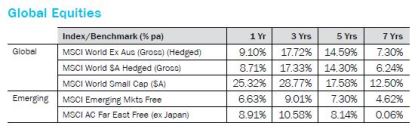
Over the 12 months to 30 June 2015, the best performers were the exceptionally strong Asian markets. The Shanghai Composite Index, the Nikkei and the Hang Seng, were up 108.8%, 33.5% and 13.2% respectively. On the other hand, the underperformers over the 12 month period were the UK, down 3.3%, the Australian All Ordinaries, up 1.3%, and the Dow Jones Index up 4.7%.
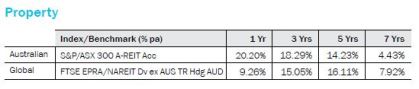
The S&P/ASX 300 A-REIT Index was down 5.5% while the 12 month return was 15.3%. The S&P/ASX 300 A-REIT Accumulation Index’s was down 4.0% in June. The S&P/ASX300 AREIT accumulation index performed marginally better compared to the broader Australian market, as measured by the All Ordinaries Accumulation Index that was down 5.4% in June.
On a 12 month rolling basis, the Australian listed property market, as measured by the S&P/ASX 300, A-REIT Accumulation Index was up 20.2%, which significantly outperformed the ASX300 Accumulation Index that was up 5.6%.
Over 1 and 3 years, the A-REITs outperformed global REITs while this was reversed over a 5 and 7 year period. Global property, as represented by the FTSE EPRA/NAREIT Index, was up 9.2% over the rolling 1 year period.
In June, US 10 year bond yields were up 10.3% and closed the month at 2.35%. Australian 10-year bond yields were 10.2% higher, and closed the month at 3.01%.
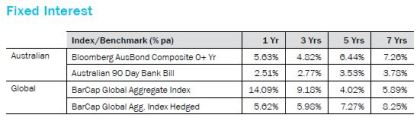
For June, Bloomberg AusBond Composite 0+ Yr index (formerly known as the UBS Composite Bond 0+Yr Index) was down – 0.93%. Global bonds (unhedged), as measured by the Barclays Capital Global Aggregate Index, posted a – 0.85% decline in June. The Hedged version was down -1.07%
On a 12 month basis, the unhedged global bonds index returned 14.09%, outperforming Australian bonds that returned 5.63%.The hedged global bonds index posted a strong one year gain of 5.62%.
Australian dollar
In June, the trade weighted index (TWI) was marginally higher, up 0.16%, but down 11.4% in the 12 month period to 30 June 2015.
The AUD increased 0.41% against the USD in June, to finish the month at 77 US cents. On a 12 month basis, the AUD declined 18.6% against the USD.
The AUD declined against the Euro, down 1.2% in June. On a 12 month basis, the AUD was marginally higher up 0.07% against the Euro.
Against the Japanese Yen, the AUD was down 0.99% in June. On a 12 month basis, the AUD was down 1.64% against the Yen.
Against the British Pound, the AUD was down 2.57% in June. On a 12 month basis, the AUD was down 11.47% relative to the British Pound.
The information contained in this Market Update is current as at 7/7/2015 and is prepared by GWM Adviser Services Limited ABN 96 002 071749 trading as ThreeSixty Research, registered office 105-153 Miller Street North Sydney NSW 2060. This company is a member of the National group of companies.
Any advice in this Market Update has been prepared without taking account of your objectives, financial situation or needs. Because of this you should, before acting on any advice, consider whether it is appropriate to your objectives, financial situation and needs.
Past performance is not a reliable indicator of future performance. .Before acquiring a financial product, you should obtain a Product Disclosure Statement (PDS) relating to that product and consider the contents of the PDS before making a decision about whether to acquire the product